- June 8, 2022
- Posted by: admin
- Category: BitCoin, Blockchain, Cryptocurrency, Investments
Entities transacting on Bitcoin, network value and the number of addresses with non-zero balances all continue to grow, pointing toward greater adoption.

The below is an excerpt from a recent edition of Bitcoin Magazine Pro, Bitcoin Magazine’s premium markets newsletter. To be among the first to receive these insights and other on-chain bitcoin market analysis straight to your inbox, subscribe now.
Active Entities Growth
In today’s issue, we’re covering the latest state, health and growing valuation of the Bitcoin network. As price faces another major cyclical all-time high drawdown seen several times over bitcoin’s lifetime, there are growing fundamentals under the surface that continue to set higher floors for valuation.
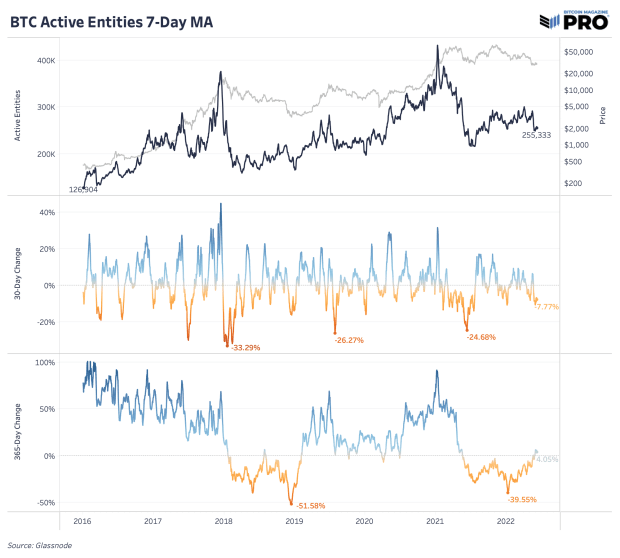
One of those key metrics is the growth of active entities on the network. Active entities are estimated clusters of addresses that are controlled by the same individual, institution or market participant. “Active” is defined as having received or sent bitcoin on that day. It’s derived from Glassnode’s data science and heuristics techniques so it’s an imperfect measure, but one that has done well at tracking growing demand over time. More on their methodology can be found here.
Looking at the chart below, active entities have more than doubled since 2016 — from 126,904 to 255,333. The past two cycle tops were preceded by elevated growth and spikes in active entities, reaching 376,549 and 432,636 in 2016 and 2021 respectively. As each cycle has printed new highs in active entities, the subsequent bottoms have seen a trend of higher lows. This paints a clear picture of the growing number of new “users” that are using Bitcoin’s on-chain transactions over time.

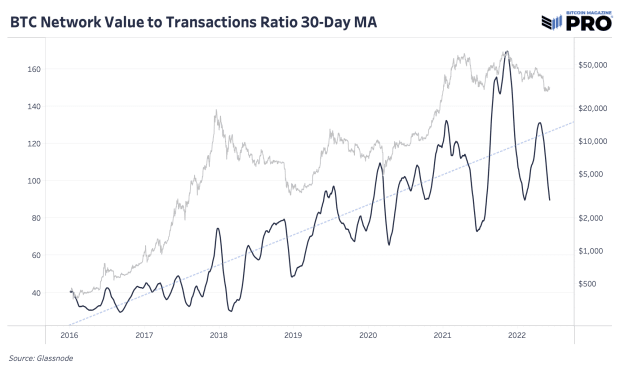
There are many attempts to derive and assess Bitcoin’s evolving market valuation. One of those useful attempts is the Network Value to Transactions (NVT) ratio which is a ratio of bitcoin’s USD market cap relative to the USD value of on-chain transaction volume, adjusted for internal entity activity. Bitcoin’s NVT ratio shows a clear trend of the network becoming more valuable over time. Higher above-trend values indicate that price is overvalued while lower below-trend values show that price is undervalued.
There’s an increasing amount of bitcoin supply that can move hands off-chain, especially on exchanges, and the growing adoption of the Lightning Network which is not captured accurately in the NVT ratio below.

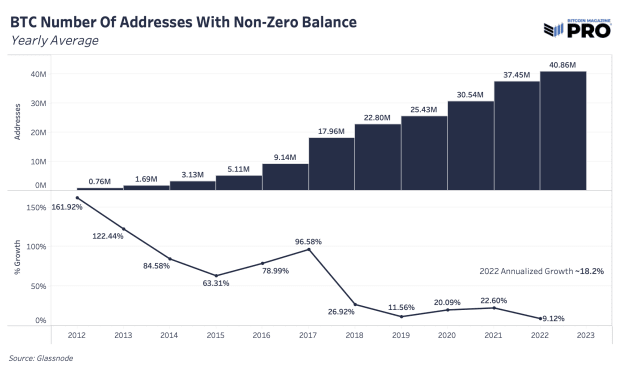
Next we have a view of the number of the Bitcoin addresses with a non-zero balance since 2012. Determining the number of Bitcoin “users” has always been a challenge which is why the entities metric were developed above. Although there are issues with just counting addresses (i.e., a user can have several addresses and a single exchange address can represent thousands of users), it’s a simple view to see Bitcoin’s growing adoption. The number of non-zero balance addresses continues to see annual double-digit growth with 2022 annualized growth at 18.2%.

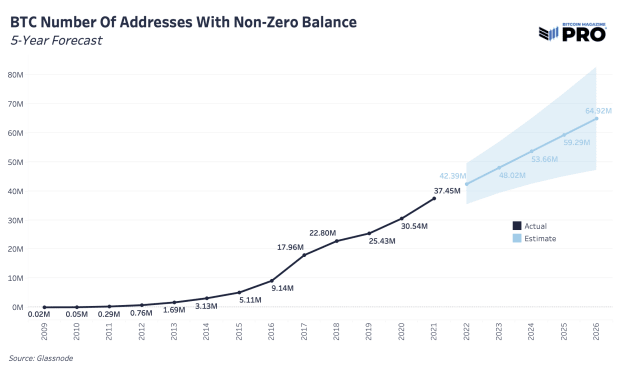
Using a simple and conservative trend forecast model, non-zero balance addresses will nearly double by 2026 at this pace. That projection only assumes annual growth each year of 10-13%, well below the current trend. Effectively, this high-level view reflects Bitcoin’s S-curve adoption taking shape over time.

What’s important is that the Bitcoin network is operational 24/7/365 as the world’s most efficient and secure value-storage and settlement network to any user who wishes to utilize it.

