- December 6, 2021
- Posted by: admin
- Category: BitCoin, Blockchain, Cryptocurrency, Investments
A quant has explained how the Bitcoin exchange reserve on-chain indicator differs between the current crash and that of May’s.
After Spiking Ahead Of The Crash, Bitcoin Exchange Reserves Have Resumed Downtrend
As explained by an analyst in a CryptoQuant post, the current trend in BTC exchange reserves is quite different from when the crypto crashed in May.
The “all exchanges reserve” is a Bitcoin indicator that measures the total amount of coins currently present in wallets of all exchanges.
If the metric’s value goes up, it means investors are depositing their coins to exchanges. Holders usually transfer their BTC to exchange wallets for withdrawing to fiat or for purchasing altcoins. Because of this, such a trend may be bearish for the coin.
On the other hand, if the exchange reserve goes down, it implies holders are withdrawing their Bitcoin to personal wallets. As investors usually do this for hodling purposes, this kind of trend can be bullish for the crypto.
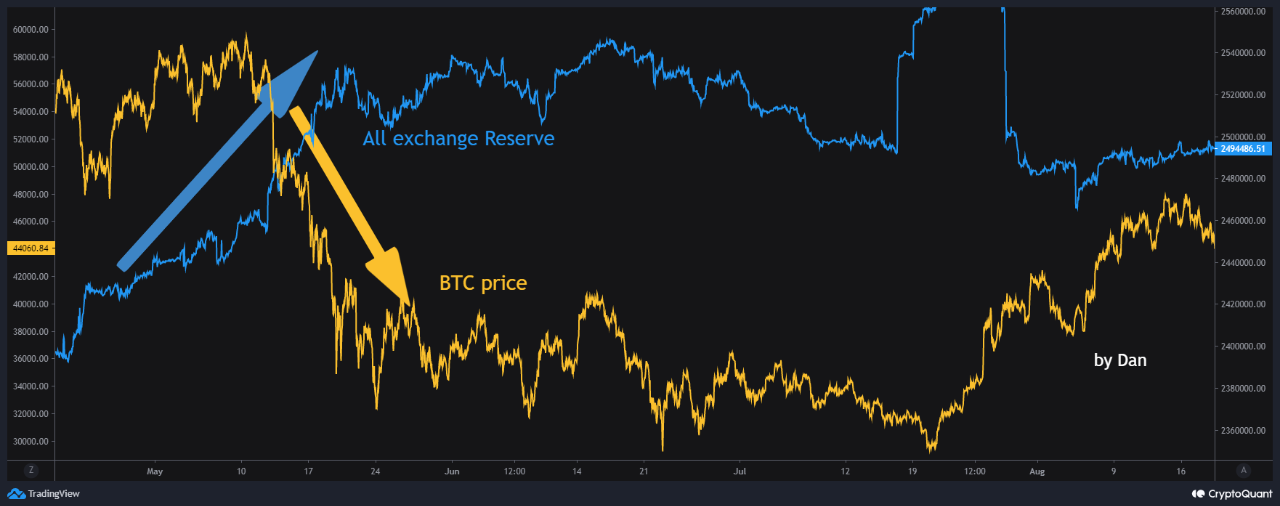
Now, here is a chart that shows the trend in the value of the BTC exchange reserve around the May 2021 crash:

The indicator sharply rose around the May 2021 crash | Source: CryptoQuant
As the above graph shows, Bitcoin exchange reserves were showing an uptrend since a while before the crash. After the price decline, the indicator mostly moved sideways for months.
Related Reading | New Study Says Ethereum May Become A Better Inflation Hedge Over Bitcoin
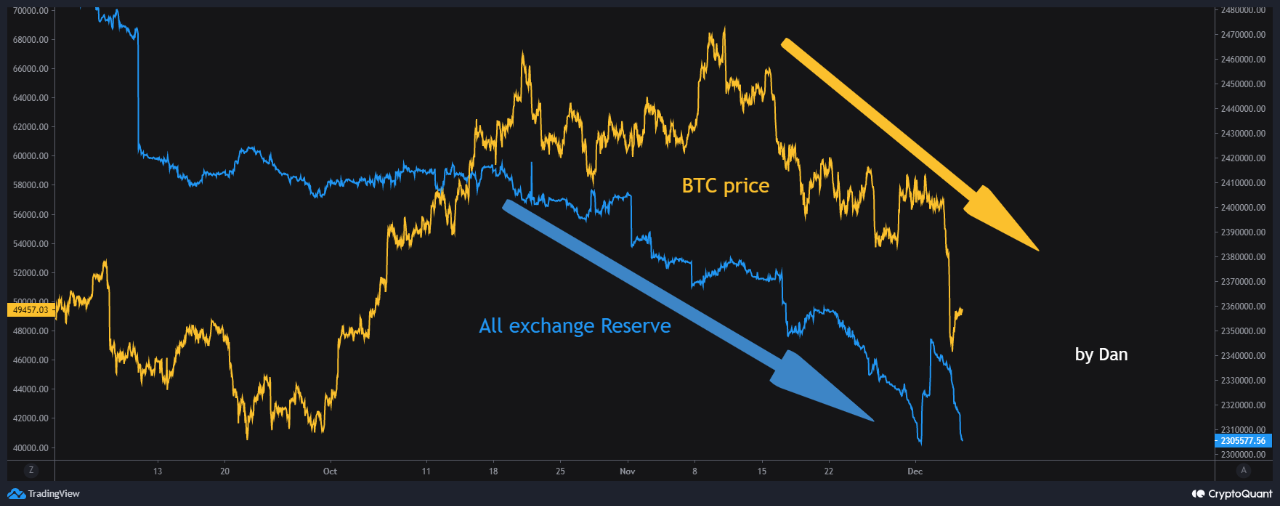
Below is another chart, this time for the metric’s current trend.

Looks like the reserves have been declining recently | Source: CryptoQuant
According to this graph, the value of the indicator had been dropping off since a while. However, right before the Bitcoin crash, the metric’s value suddenly shot up.
But since the price crash, the reserves have again come down, and looking set to resume the previous downtrend.
Related Reading | Nayib Bukele Responds To Bank Of England’s Bitcoin Criticism
This means that overall, the reserves have been declining for a while now. This is where the current market differs from that of May.
The quant believes that because of this trend, Bitcoin is still bullish in the mid or the long term, unless the reserves flip upwards.
BTC Price
At the time of writing, Bitcoin’s price floats around $48.2k, down 15% in the last seven days. Over the past month, the crypto has lost 21% in value.
The below chart shows the trend in the price of BTC over the last five days.

BTC's price has consolidated since the crash | Source: BTCUSD on TradingView
A few days back, Bitcoin’s price crashed down to $42k, before quickly jumping back up to the current levels. However, since then, the coin has not showed any signs of recovery as it has mostly moved sideways.
Featured image from Unsplash.com, charts from TradingView.com, CryptoQuant.com