- July 5, 2024
- Posted by: admin
- Category: BitCoin, Blockchain, Cryptocurrency, Investments
Bitcoin’s volatility in the past week created the perfect market conditions for analyzing the behavior difference between long-term and short-term holders. Previous CryptoSlate reports highlighted the importance of these two cohorts and how their actions influence the market.
Between June 28 and July 3, Bitcoin’s price fluctuated between $60,000 and $62,000. It failed to find support on July 4, dropping below $60,000 in late US hours. While this timeframe and volatility might not seem significant, they provide a perfect backdrop to understand how each portion of the market moved.
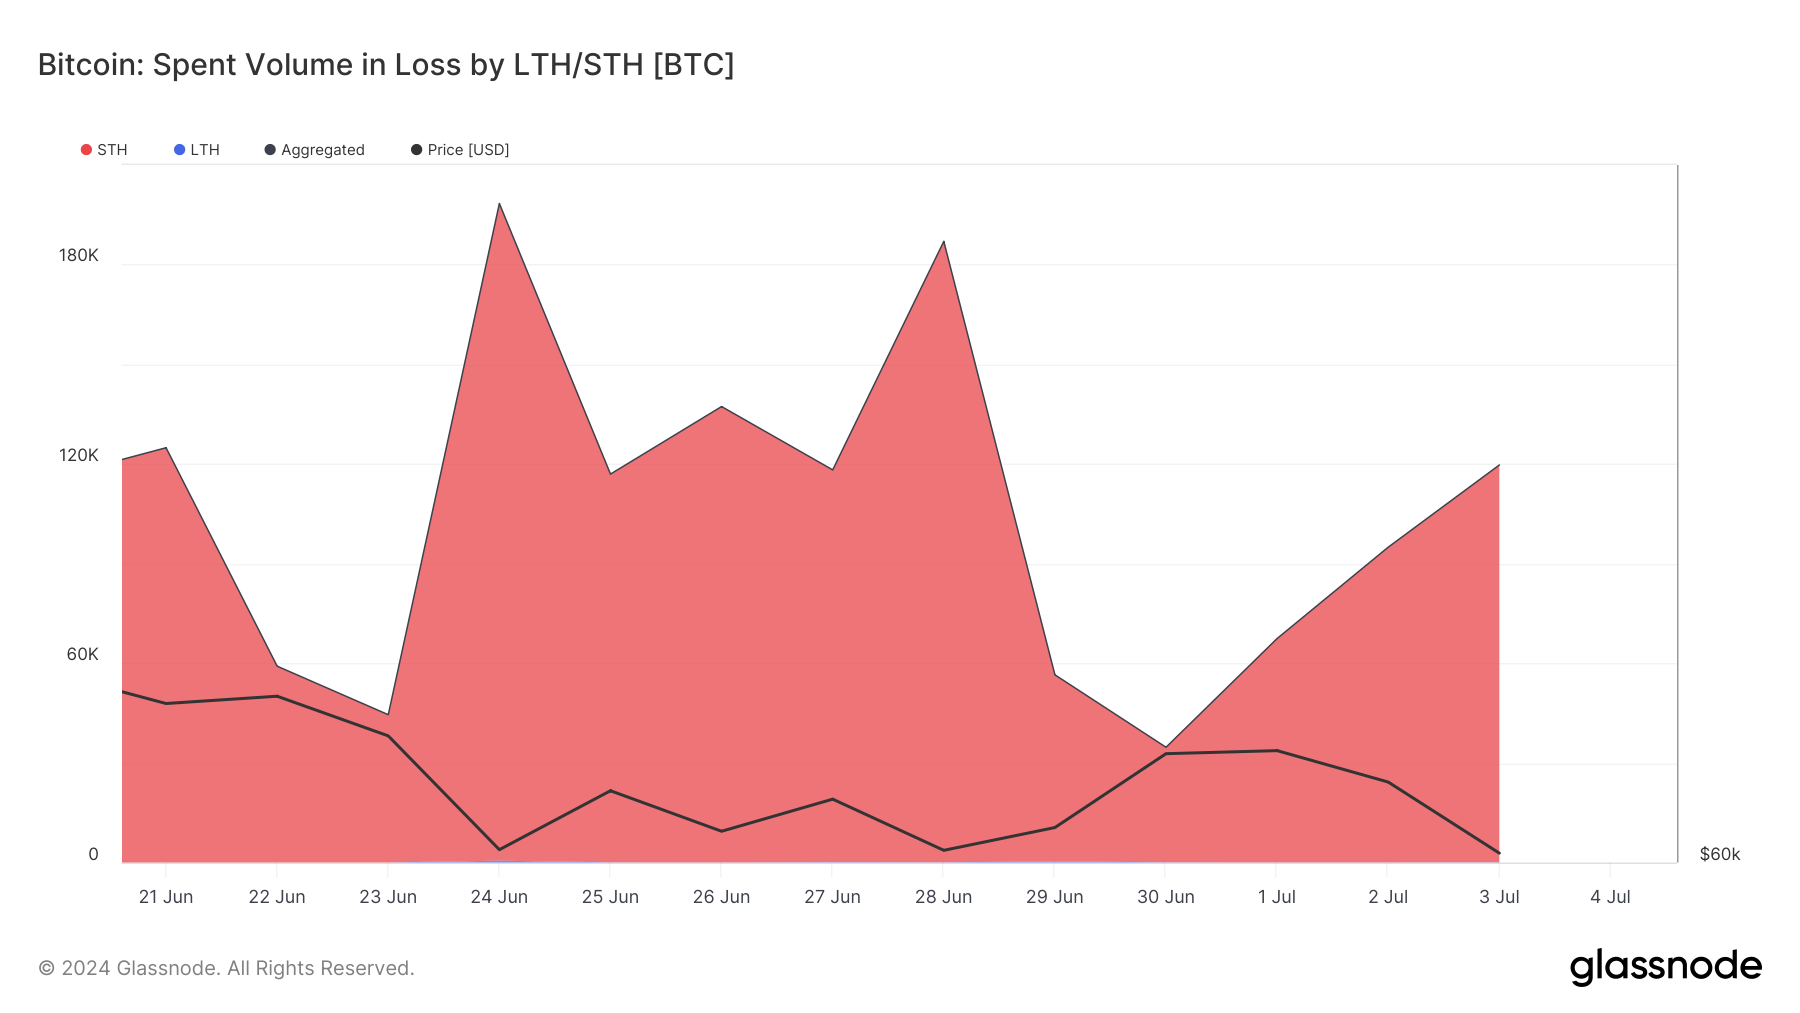
With Bitcoin’s price struggling to leave $60,000 on June 28, short-term holders spent 186,945 BTC in loss. This sharply contrasts with long-term holders, which showed a minimal loss volume of just above 61 BTC. As Bitcoin regained some strength at $62,000, STHs showed a notable drop in spent volume in loss to 34,642.
The brief period of reduced losses showed a short moment of confidence, with STHs most likely anticipating further growth. However, by July 3, the spent volume in loss for STHs climbed to 119,623 BTC, showing a resurgence of selling pressure.
During this period, STHs accounted for over 99% of the spent volume in loss. In contrast, the percentage of spent volume in loss from LTHs ranged from 0.033% to 0.589%. Such a low percentage shows how unlikely long-term holders are to sell their BTC at a loss compared to short-term holders.

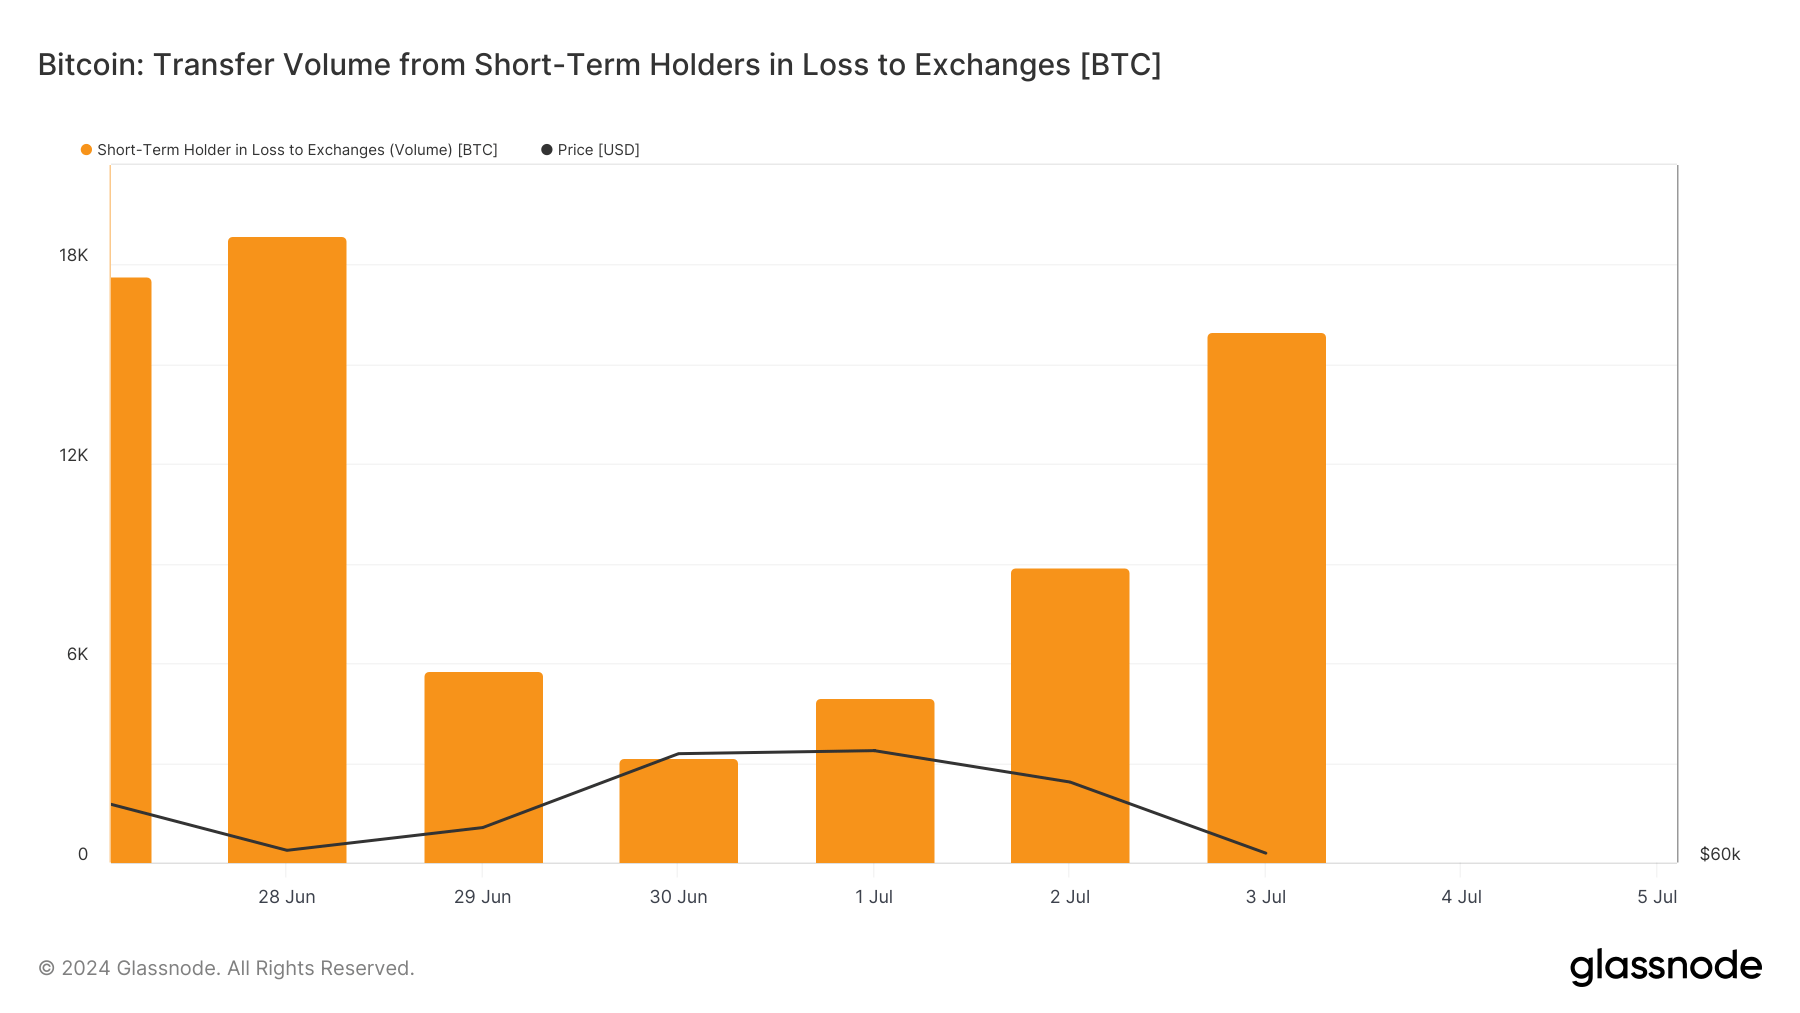
Transfer volumes from STHs in loss to exchanges show how much of that spent volume ended up on exchanges. On June 28, a high of 18,861 BTC was transferred, showing panic and urgent liquidity needs among STHs.
This volume dropped significantly over the following days, reaching a low of 3,178 BTC on June 30, reflecting a temporary reduction in selling pressure in spent volume. The subsequent increase to 15,980 BTC on July 3 aligns with the observed increase in spent volumes in loss and declining prices, further confirming an increase in selling pressure.

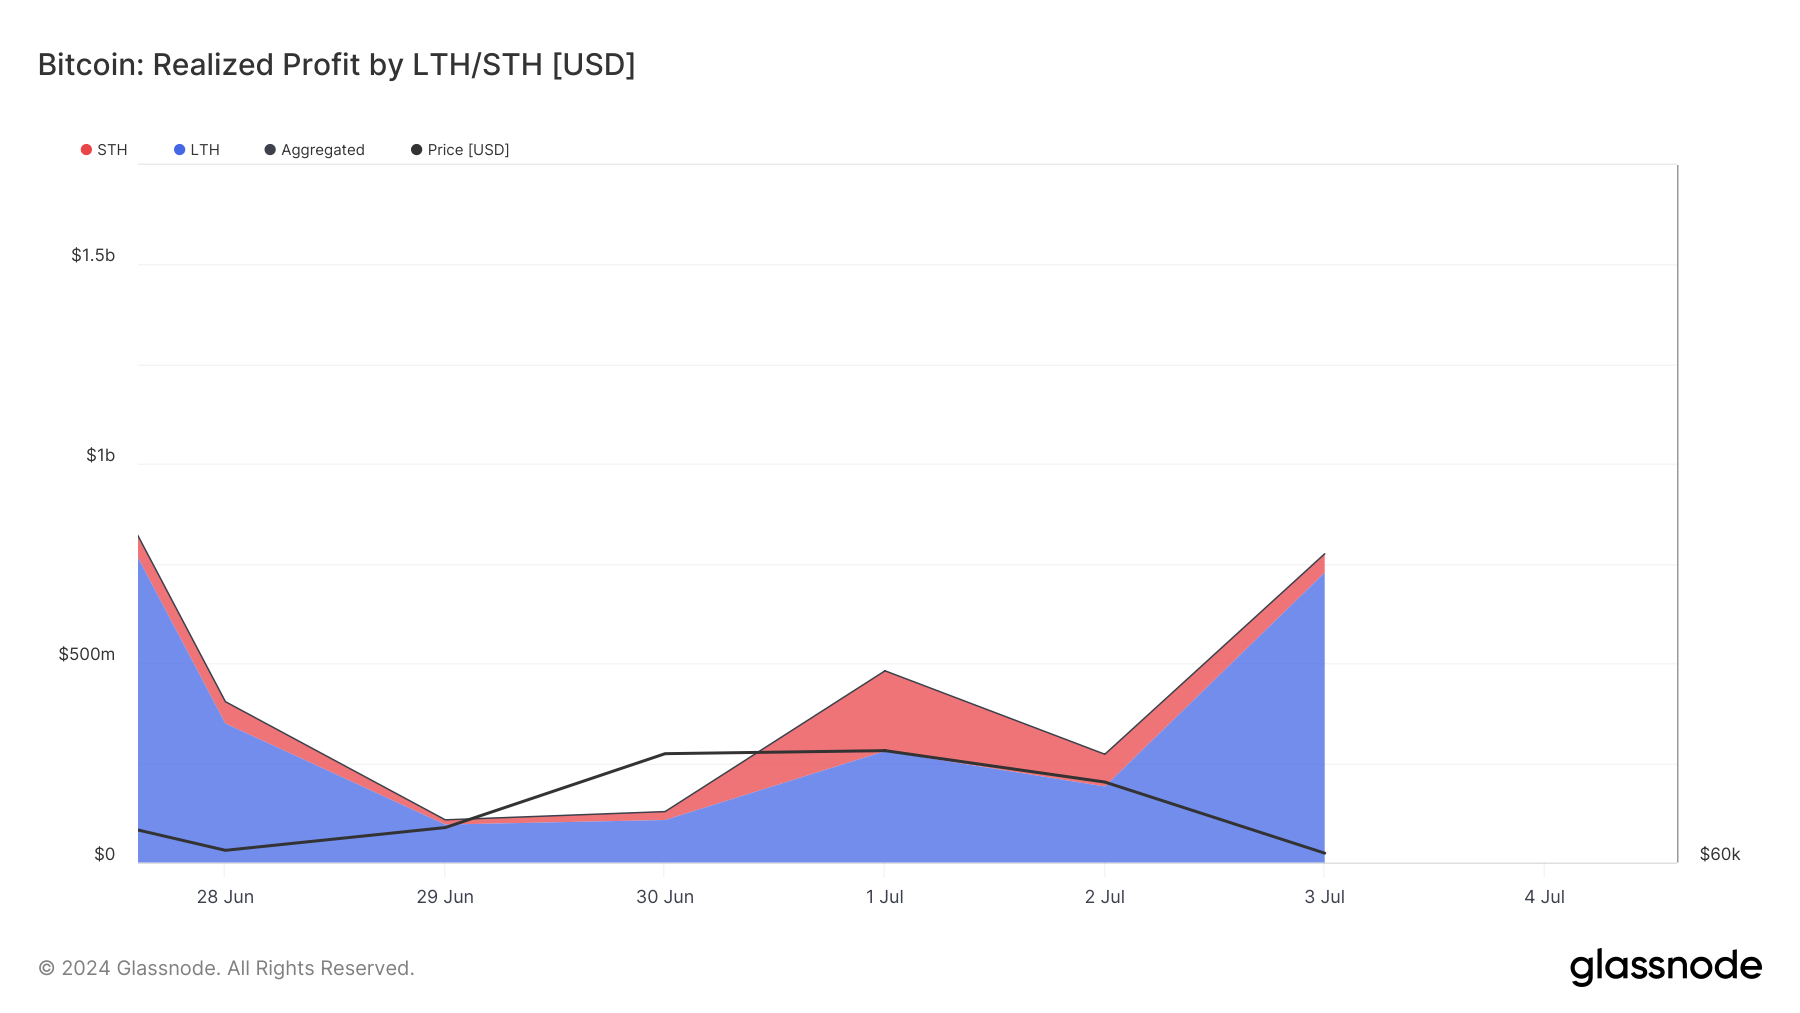
The disparity between LTHs and STHs is also evident in the difference in realized profit. The realized profit percentages from long-term holders are significantly high, often exceeding 80% during this period and reaching up to 93.91% on July 3. On June 28, LTHs realized substantial profits of $348.708 million, contrasting with STHs’ modest $54.773 million.
Interestingly, on July 1, both groups realized significant profits, with STHs at $201.597 million and LTHs at $279.358 million, coinciding with a peak Bitcoin price of $62,833. This suggests that both cohorts seized the opportunity to lock in gains at this price peak.

This data paints a clear picture of the difference in behavior and strategies of these cohorts. Short-term holders show extremely reactive behaviors, quickly adjusting their positions and offloading significant volume based on immediate market changes.
Long-term holders, on the other hand, show a more strategic and calculated response. The disparity in their behavior shows a market in a state of flux, with price movements and volumes showing a combination of profit-taking and loss-mitigation strategies.
The post Long-term holders realize all of the profit and none of the losses appeared first on CryptoSlate.
