- November 23, 2021
- Posted by: admin
- Category: BitCoin, Blockchain, Cryptocurrency, Investments
Data shows Bitcoin whales now account for 91% of the deposits going to exchanges, a trend that could be a bearish signal.
Bitcoin Exchange Whale Ratio Surges To 91%
As pointed out by a CryptoQuant post, the BTC all exchanges whale ratio has now risen to 91%, a historically bad sign for the crypto.
The “exchange whale ratio” is a Bitcoin indicator that’s defined as the total BTC amount of top 10 transactions divided by the total number of coins flowing into exchanges.
Put simply, the metric tells us how the ten biggest transactions going to exchanges compare with the total deposits.
If the value of this ratio is high, it means whale Bitcoin transactions make up a large share of the whole deposits during the specific period. Such a situation may be bearish for the coin.
While if the indicator’s value is low, it implies not too many whales are currently selling on exchanges. This trend can be bullish for the crypto.
Related Reading | El Salvador To Build The First Bitcoin City Using Tokenized Bitcoin Bonds
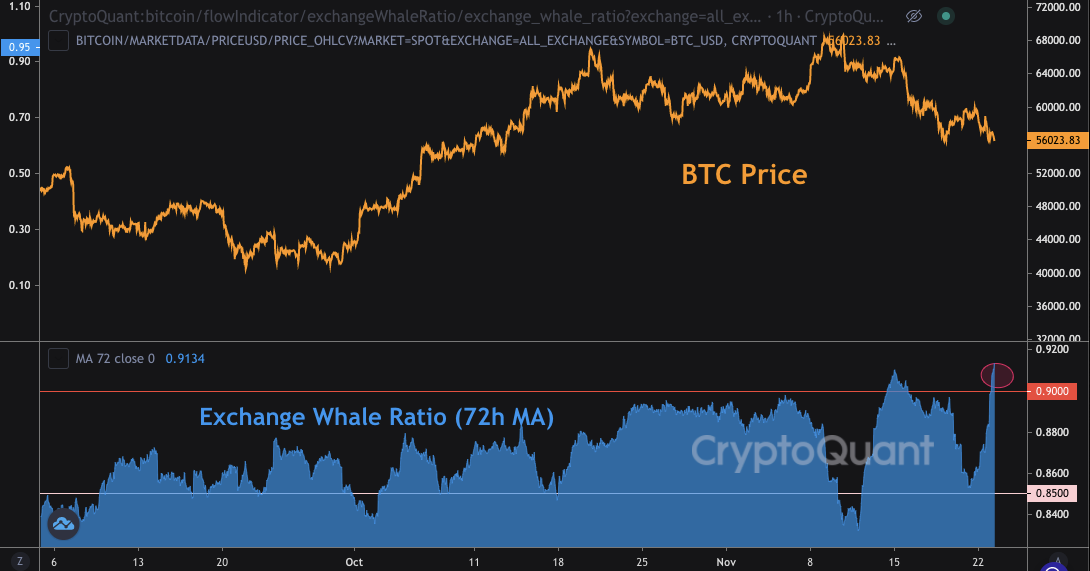
Now, here is a chart that shows how the Bitcoin whale ratio has changed recently:

Looks like the value of the indicator shot up in the past day | Source: CryptoQuant
As the above graph shows, the Bitcoin whale ratio seems to have spiked up earlier today as whale transactions now occupy 91% of the total exchange deposits.
Usually, values higher than 85% are taken as signs of dumping. When BTC’s price crashed from above $66k around a week ago, the ratio shot up above 90% just before it.
Related Reading | PlanB Clarifies $98k Nov Bitcoin Target Isn’t Based On S2F
Since the indicator has now risen to similarly high values as then, whales might be dumping once again. If the trend keeps up, it could land another blow to an already declining Bitcoin market.
BTC Price
At the time of writing, Bitcoin’s price floats around $56.2k, down 5% in the last seven days. Over the past thirty days, the crypto has lost 7% in value.
The below chart shows the trend in the price of the coin over the last five days.

BTC's price once again looks to be slipping away | Source: BTCUSD on TradingView
Ever since Bitcoin started declining after it set a new all-time high around $69k, the crypto hasn’t shown any signs of recovery. In the past week, BTC has mostly consolidated between the $60k and $55k price marks.
If the exchange whale ratio is anything to go by, the coin may be kicked down even further from here. However, not all signs are negative. According to the Puell Multiple, it seems miners don’t feel enough pressure to sell at this level, a bullish indicator.
Featured image from Unsplash.com, charts from TradingView.com, CryptoQuant.com