- June 10, 2022
- Posted by: admin
- Category: BitCoin, Blockchain, Cryptocurrency, Investments
Looking at different metrics can help determine bitcoin’s place in the traditional market cycle and how macroeconomics can impact the bitcoin price.
Watch This Episode On YouTube or Rumble
Listen To The Episode Here:
In this episode of the “Fed Watch” podcast, Christian and I sit down with Dylan LeClair, head of market research at Bitcoin Magazine Pro. Each week, he and Sam Rule write near-daily updates for subscribers, and once a month they release a large Bitcoin market report. Bitcoin Magazine Pro’s “May 2022 Report” is what we are covering for the most part in today’s episode.
You can find the slide deck we use for this episode here, or you can see all the charts at the end of this post.
“Fed Watch” is the macro podcast for Bitcoiners. Each episode, we discuss current macro events from across the globe, with an emphasis on central banks and currency matters.
Market Cycle
Before we get into the awesome charts that LeClair brought, I want to get an idea of where he sees bitcoin in its market cycle timing. I ask, somewhat facetiously, if we are in a bear market, because we are definitely not in a typical 80-90% drawdown.
LeClair responds by saying we are in a classic bear market, not necessarily a classic bitcoin bear market. He points out that the upswing of this cycle didn’t have the typical parabolic blow-off top we’ve seen previously in bitcoin, as well as there being more technical and fundamental support in the mid-$20,000s up to $30,000 — so drawdown pressure will also likely be limited. LeClair also adds that the average user cost basis was hit by the wick to the recent lows. All in all, there is significant support under the current price and it remains to be seen if there is enough bear momentum to break to new lows.
Lastly, on the market-cycle timing questions, LeClair points out a very underappreciated market development: the collateral type on exchanges has mostly switched from bitcoin in previous cycles to now being stablecoins like Tether (USDT) and USDC. In other words, the dominant trading pairs and cash deposits on exchanges have changed from bitcoin to stablecoins. In the past, the most important trading pair for any altcoin was versus BTC, which has changed to being versus a stablecoin like USDT. This is a monumental shift in market dynamics and will likely lead to much more stable prices for bitcoin, because less bitcoin will be forced to liquidate in the hyper-speculative shitcoin bubbles.
Bitcoin Magazine Pro Charts
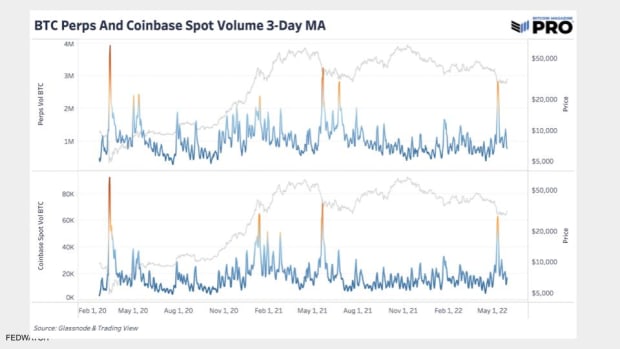
“This is Coinbase spot volume, being the dominant American exchange, and the Perp [perpetual futures] volume aggregated over a bunch of different derivatives exchanges. What we can see is various volume spikes. Historically, when bitcoin is trading hands in that size, it signals some sort of market top or bottom, some significant change in market structure.” – Dylan LeClair
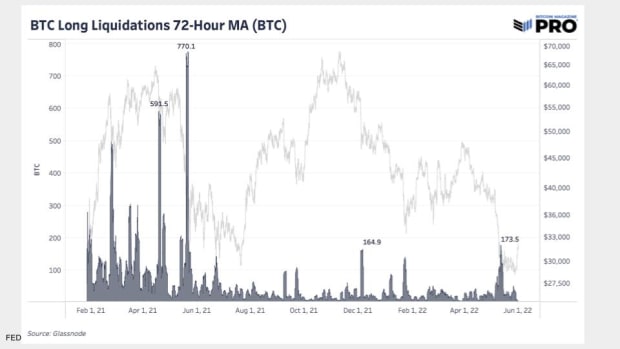
The next chart shows the difference in market structure due to stablecoins. LeClair says that 70% of the derivative market was still collateralized by bitcoin around the 2021 summer sell-off. Today, it is much much smaller than that. Therefore, we should expect there to be fewer liquidations in bitcoin when shitcoin bubbles pop, and that’s exactly what we see.
What is great about the Bitcoin Magazine Pro newsletters is they not only look at the bitcoin market but also how macro could be affecting bitcoin. The next two charts are about CPI and interest rates. LeClair does a great job breaking these down during the podcast.
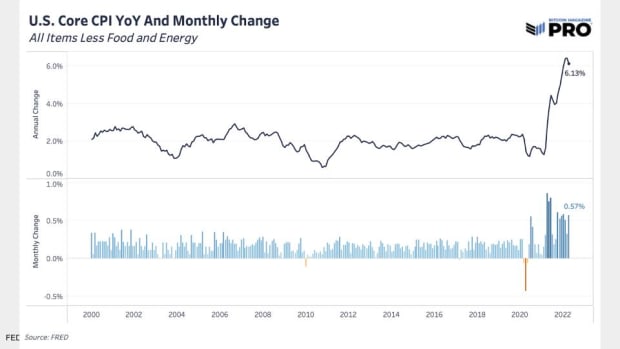
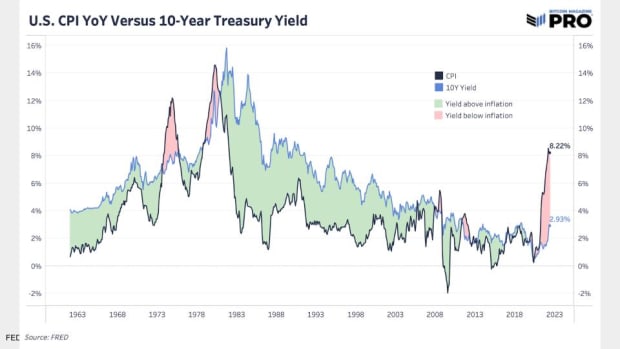
I ask LeClair about his thinking on the Federal Reserve monetary policy, and he focuses his analysis around real interest rates. He says real rates will have to stay negative in order to erode the massive global debt burden. Therefore, if the Fed hikes even to 3.5%, for real rates to stay negative the CPI will have to stay above that.
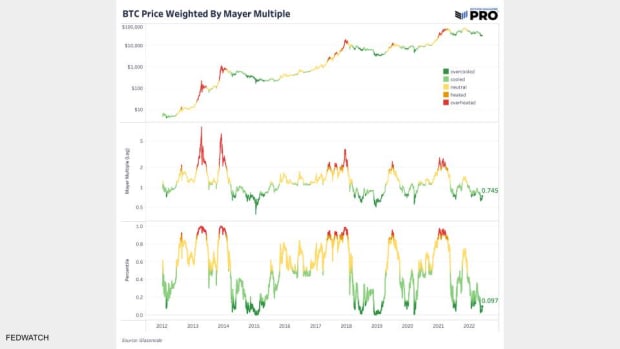
Next up is CK’s favorite indicator, the Mayer Multiple, or the 200-day moving average price divided by current price. When the price is below the 200-day moving average, this ratio is below 1, and has historically been a good way to time the market.
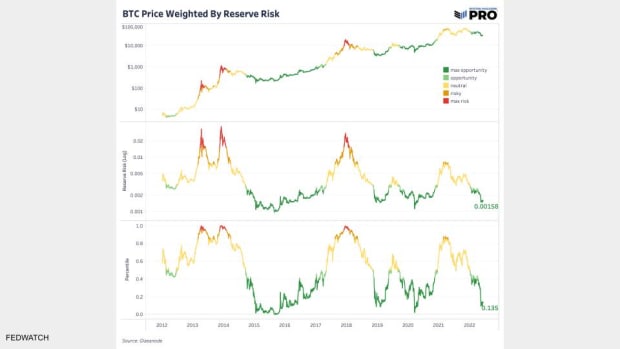
One of the most dense informational charts on Bitcoin Magazine Pro is up next, and that is Reserve Risk.
“The Reserve Risk chart basically weighs Hodler conviction, whether strong or weak, with price.”
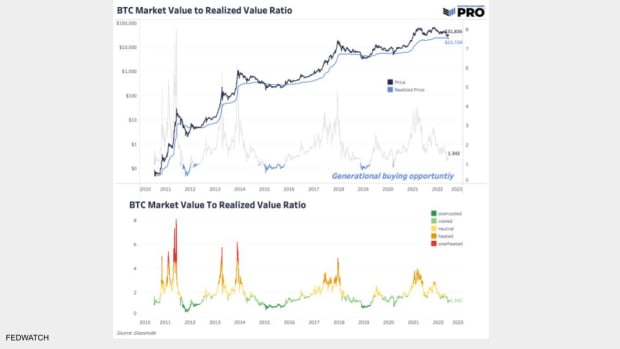
Our last chart for the day is Realized Price, and this is LeClair’s favorite. It is a great way to strip out much of the noise and volatility of the bitcoin price and concentrate on the trend.
“One of the cool things about the transparency of this network is, we can see when every single bitcoin has ever moved, or was ever mined. We can also [assign each UTXO a price of when it last moved] to come with what we call Realized Price. […] We can see when everyone is underwater on average.” – LeClair
Bitcoin Regulation from Senator Lummis
At the end of the show we wrap up with a discussion on the recently proposed draft legislation, by Senator Lummis, that outlines a new framework for bitcoin and what the bill calls “digital assets.” In fact, they don’t use the terms bitcoin, Ethereum, blockchain or even cryptocurrency in the draft at all.
Suffice it to say, we tease out some opinions from LeClair and go back and forth with the livestream crew, but you’ll have to listen to get that whole insightful discussion! We dive into the effects on the bitcoin market, exchanges and a future bitcoin spot ETF!
That does it for this week. Thanks to the readers and listeners. If you enjoy this content please subscribe, review and share!
This is a guest post by Ansel Lindner. Opinions expressed are entirely their own and do not necessarily reflect those of BTC Inc. or Bitcoin Magazine.
