- March 27, 2026
- Posted by: admin
- Category: BitCoin, Blockchain, Cryptocurrency, Investments

The post XRP Price Analysis: Is a Breakout or Crash Coming Next? appeared first on Coinpedia Fintech News
XRP price analysis shows the market entering a critical phase as conflicting signals begin to emerge beneath the surface. With XRP price trading around $1.33, derivatives data reflects a sharp increase in open interest, pointing to growing trader participation. At the same time, liquidation heatmaps reveal clearly defined liquidity zones, suggesting that price is now trading between key levels where strong reactions are likely.
This combination of rising positioning and structured liquidity zones often precedes significant moves. As volatility compresses and pressure builds, XRP appears to be approaching a decisive moment where the next breakout could define its short-term trend.
XRP Open Interest Climbs, Signaling Volatility Expansion
Recent derivatives data shows XRP’s open interest climbing to 14.8%, marking a notable increase in leveraged positioning across major exchanges.
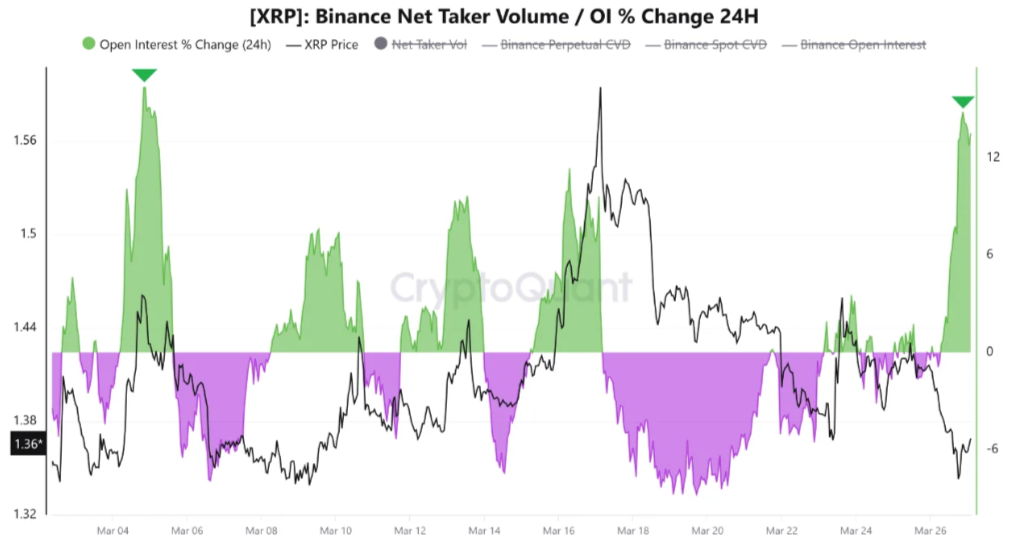
This rise reflects renewed interest from traders positioning ahead of a potential move. Typically, such increases signal that the market is preparing for expansion, as both long and short positions build simultaneously. However, higher open interest also introduces increased volatility. As leverage builds, price movements tend to accelerate, often leading to sharp directional moves once key levels are tested.
In XRP’s current structure, the rise in open interest suggests that the market is coiling for a breakout, with positioning building ahead of a potential volatility expansion phase.
XRP Liquidation Map Identifies Key Support and Resistance Zones
Liquidation heatmap data provides a clearer picture of where liquidity is concentrated, helping define XRP’s key reaction zones. A dense cluster of liquidity is visible around the $1.25–$1.30 region, establishing this area as a strong support zone. This level has consistently attracted buying interest, as liquidity below it creates conditions for potential rebounds.
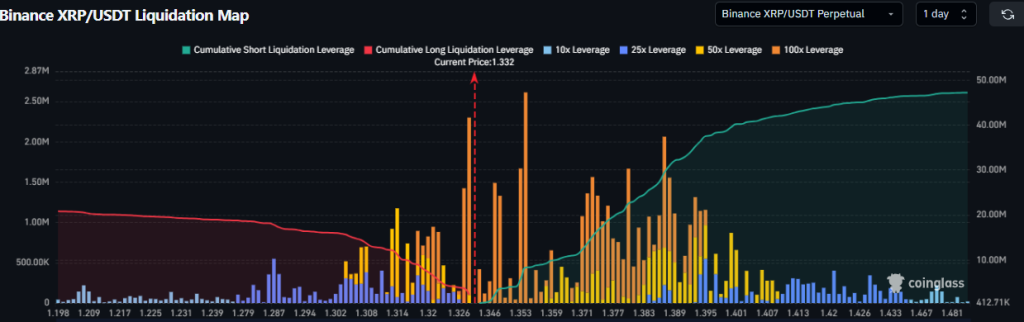
On the upside, significant liquidation concentration is observed near $1.45, marking it as an immediate resistance level. Beyond that, a larger liquidity pocket exists between $1.90 and $2.00, which could act as a major barrier if bullish momentum develops. These zones do not indicate weakness but rather highlight where price is likely to react. Markets are naturally drawn toward liquidity, and XRP is currently positioned between these key levels, suggesting that the next move may be driven by a liquidity sweep rather than gradual momentum.
Sharpe Ratio Turns Positive, Suggesting Stabilization
Amid rising activity, XRP’s Sharpe Ratio has turned positive, indicating an improvement in risk-adjusted returns. This shift suggests that recent price performance is becoming more efficient relative to volatility, pointing to early signs of stabilization.
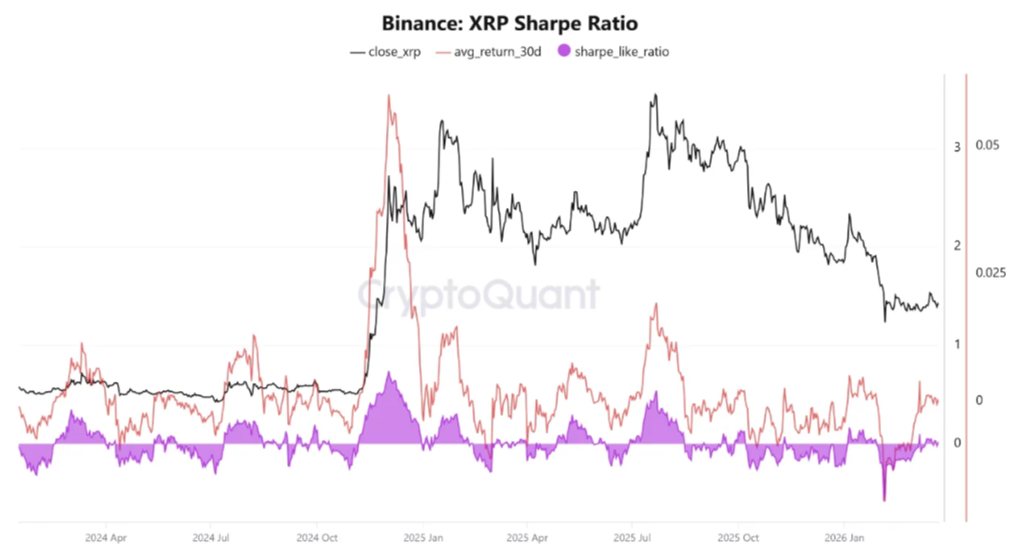
While not yet confirming a strong bullish trend, it reflects a transition from weaker conditions toward a more balanced market environment. Historically, such improvements often precede more sustained price movements, as stability returns beneath short-term fluctuations.
XRP Price Analysis: What’s Next for XRP?
XRP price is trading within a defined range between support and resistance liquidity zones. The $1.25–$1.30 region remains a critical support level. Holding this zone is essential for maintaining the current structure and preventing further downside.
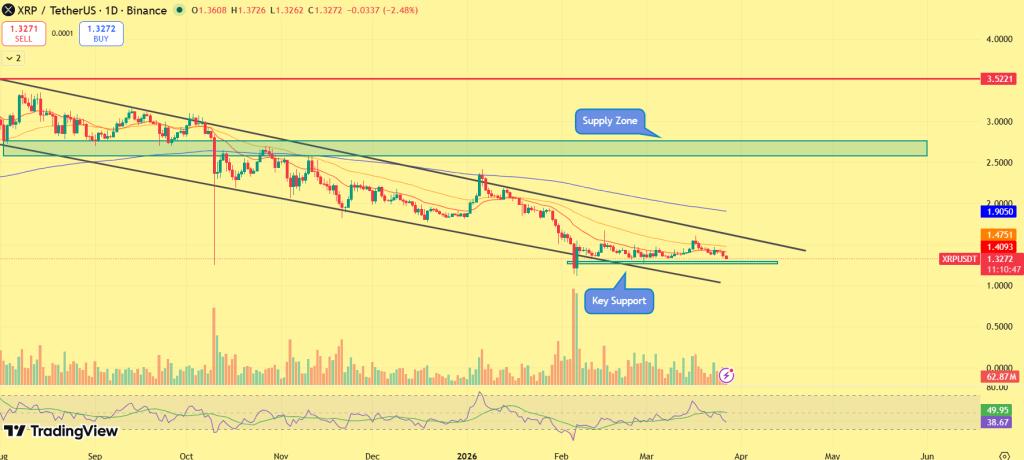
On the upside, $1.45 acts as the immediate resistance level. A breakout above this zone could trigger a move toward the $1.90–$2.00 region, where the next major liquidity cluster sits. While a break below $1.20 could push XRP price toward the $1.05-$1.10 range. As price continues to compress within this range, the likelihood of a breakout increases. The direction of this move will largely depend on which liquidity zone is tested and cleared first.
Final Words
XRP is currently positioned in a high-liquidity, high-volatility environment, where multiple signals are converging. The rise in open interest highlights growing participation, while liquidation heatmaps define clear reaction zones. At the same time, improving risk metrics suggest that the market may be stabilizing beneath the surface. This setup typically leads to decisive price action, as markets move toward liquidity clusters before establishing direction.
If XRP breaks above resistance with strong follow-through, it could initiate a recovery phase. However, a move below support may trigger a downside liquidity sweep before any sustained upside develops. For now, XRP remains in a compression phase, where the next move is likely to be sharp, fast, and driven by liquidity dynamics rather than gradual sentiment shifts.


