- December 11, 2024
- Posted by: admin
- Category: BitCoin, Blockchain, Cryptocurrency, Investments


The post Is Bonk Preparing For A Rally – Technical Indicators Are Bullish! appeared first on Coinpedia Fintech News
One of the famous memecoins, Bonk is feeling the heat of market movements. Its recent performance has been shaky. Its failed attempts to pass the latest resistance has raised concerns if it is losing power. Is there any chance to recover? Is bonk preparing for a rally? Let’s analyse the market and find out.
Prices Are Down, But Is It Over?
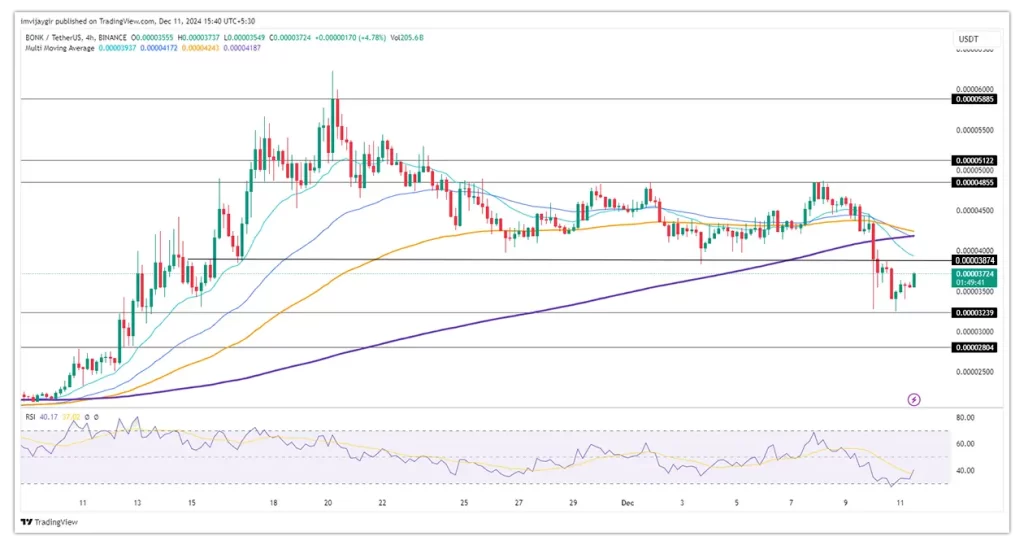
Right now, BONK is priced at $0.00003710. That’s a 2.87% drop in the last 24 hours and a 15% decline over the past week. It’s not just the price—trading volume has fallen too, down by 40.26%. The token is also 37.16% below its all-time high of $0.00005916. On top of that, BONK has struggled to break past a resistance level of $0.00004855 since November 24, failing three times.
These numbers don’t look good. BONK’s under pressure, and the path to recovery won’t be easy.
Support Levels and Bearish Signals
Very recently, Bonk has slipped below a crucial support level at $0.0000387. This has traders worried about its future. The next support lies at $0.00003239, which has some potential to prevent the price fall, in case. If that breaks, the worst scenario would be the price drop to $0.00002804.

The most concerning thing at present is the moving average 200 which has crossed over MA 20 and 50. This typically signals more downward movement. If the price does not bounce back quickly, there are chances of MA 200 crossing over MA 100 which can trigger a market panic.
Could Recovery Be Around the Corner?
Not every technical indicator is giving out a bad signal for Bonk. The RSI looks good and gives an impression of an upward movement. Currently recorded at 40.13, it is moving out of the oversold territory. This can be the bullish signal the investors have been waiting for. Is bonk preparing for the rally, BOP shows a yes sign for that. The balance of power indicator at 0.89 gives out a bullish signal.

The MACD line is edging closer to a bullish crossover. The bearish histogram is weakening too. If this crossover happens soon, it could mark the beginning of a recovery. BONK needs to reclaim $0.00003874 and close a 4-hour candle above it to regain lost ground. This could set the stage for $0.00004469 or even $0.00004855 if momentum builds.
What to Expect
For traders, BONK’s current position is both a risk and an opportunity. Those betting on a recovery might see this as a chance to buy in at lower prices. But if key support levels break, it could trigger panic selling and push prices lower.
So, what’s next? Is bonk preparing for the rally, looks like yes.Its future depends on holding its support levels and building momentum. Keep an eye on the RSI, MACD, and resistance levels. It’s not just a story of decline—it could also be one of resilience.
