- November 13, 2024
- Posted by: admin
- Category: BitCoin, Blockchain, Cryptocurrency, Investments


The post Dogecoin Price Analysis: Bull Run Targets $0.50 This November? appeared first on Coinpedia Fintech News
With a new 52-week higher formation at $0.4389, last seen in May 2021, the Dogecoin price rally is gaining momentum. Dogecoin’s market cap exceeds $53B, accounting for nearly half of the meme coin’s market cap, $110B.
However, a pullback in Bitcoin results in a minor step back in the DOGE price. Will this pullback result in a bearish reversal in the biggest meme coin? Find out more about Coinpedia’s latest Dogecoin price analysis.
Dogecoin Price Performance
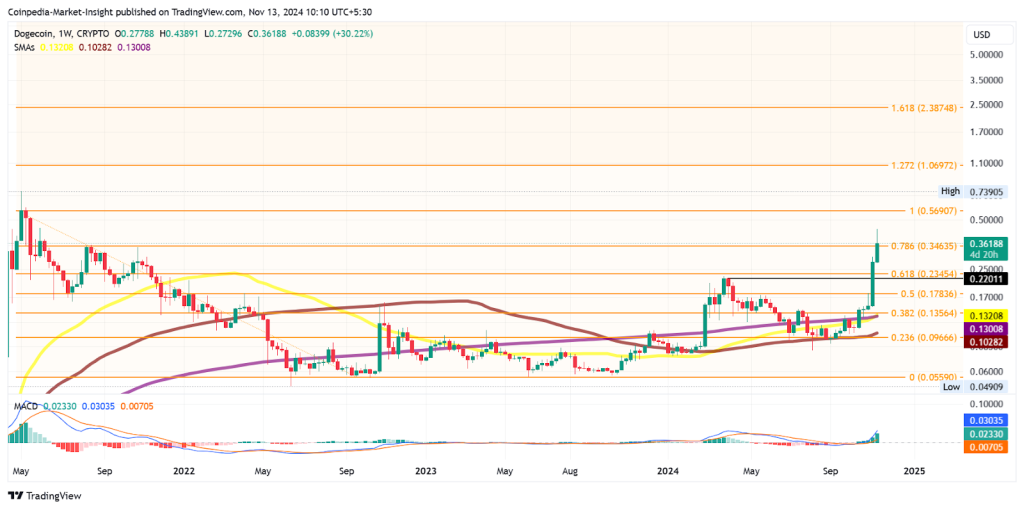
With a rounding bottom breakout, the reversal rally exceeds the 61.80% Fibonacci level at $0.23. Last week, the Doge price jumped by 83.64%, followed by a 32% recovery this week.

Currently, the Dogecoin price is trading at $0.3670, maintaining dominance above the 78.60% Fibonacci level at $0.3463. The bullish reversal in the meme coin started from the 23.60% Fibonacci level, slightly below the $0.10 psychological mark.
Since then, the Doge price has increased by nearly 300% in less than three months. The bullish trend is approaching its all-time high level of $0.73905 at high momentum.
As the buying pressure grows, the 50 and 200-week SMA lines give a golden crossover with an uptick in the 100-week SMA. Furthermore, the MACD and Signal lines skyrocket with a positive crossover with skyscraping bullish histograms.
DOGE Price Targets
If the bull run sustains a closing price above $0.3463 this week, the Dogecoin price rally will likely extend to the $0.50 psychological mark.
On the flip side, the intraday pullback of 3.24% could result in a minor retest of the $0.3463 or $0.30 levels. This will provide a retest opportunity for price action traders hoping for a post-retest reversal.
Will the Dogecoin rally hit $1 in 2024? Read Coinpedia’s DOGE price prediction for 2024-2030 to find out.
FAQs:
The immediate target is $0.50, with the potential to challenge the all-time high of $0.73905 if the momentum sustains.
Key support levels include $0.3463 and $0.30, while resistance lies at $0.50 and the all-time high at $0.73905.
The golden crossover of the 50 and 200-week SMA, strong MACD histograms, and dominance above the 78.60% Fibonacci level at $0.3463 point to sustained bullish momentum.
